

Exclusion threshold and scan data
Let scan data veto candidates: any frequency measured above the threshold is excluded from calculations — and how to scan so the threshold works reliably.
What the exclusion threshold does
Section titled “What the exclusion threshold does”The Exclusion threshold is a site-wide calculation setting (default −85 dBm) in the calculation area. Tick Enable next to it and every calculation checks candidates against the scan data the current zone displays: if a candidate’s bandwidth intersects a measured point above the threshold, the candidate is rejected. Click the pencil to change the value.
Because the check runs against whichever scans each zone displays, pick the right scan files per zone first — see Choosing which scan files a zone displays. The threshold appears on the spectrum plot as the Exclusion Threshold Line (toggle it in the plot settings), and threshold violations show up as Exclusion Threshold issues in the zone Health Check.
Why a candidate can sit “above the line” and still pass
Section titled “Why a candidate can sit “above the line” and still pass”The plot draws the scan as a connected trace, but calculation only tests the actual measured data points. If the scan’s step size is coarse, a candidate can visually sit above the threshold line while having no measured point inside its bandwidth — in that case its amplitude reports −120 dBm (the plot floor) and no hit is registered.
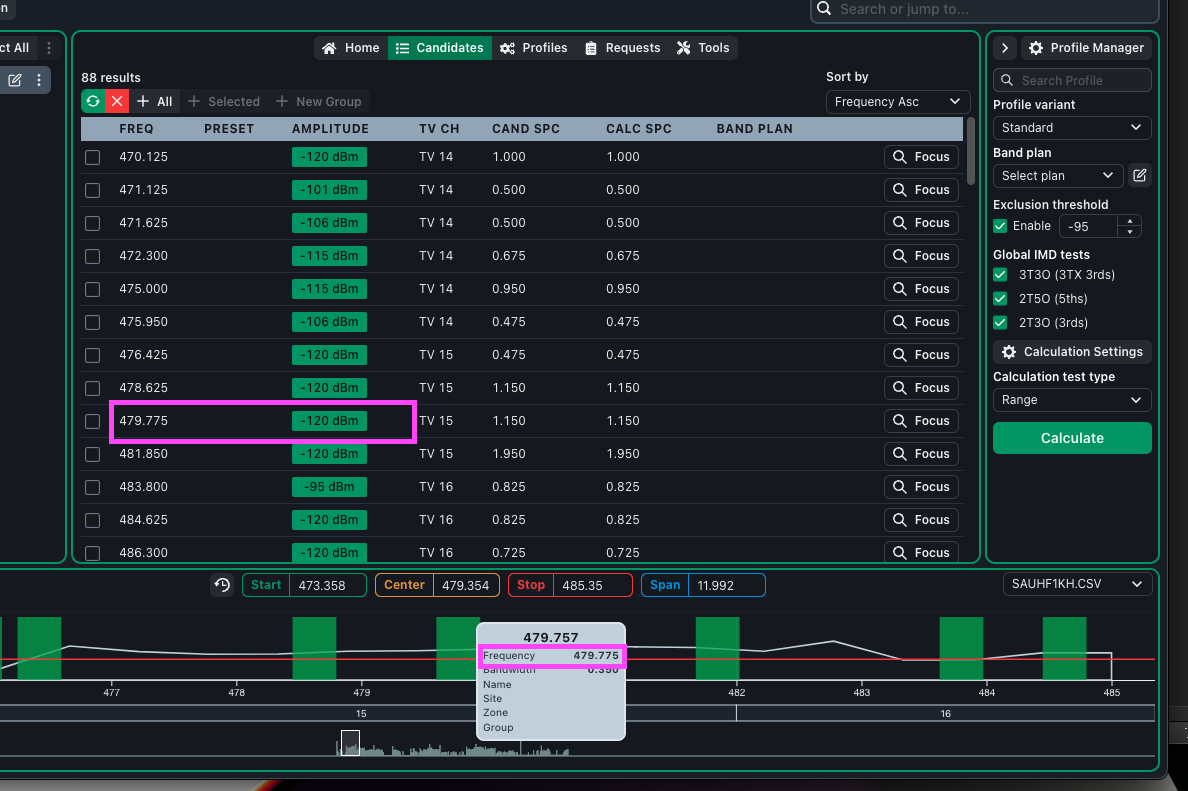
Looking at the captured points for this area makes it clear — there simply aren’t enough data points to know the real level:
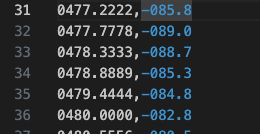
Recommendation: scan with a fine step size
Section titled “Recommendation: scan with a fine step size”Use a step size of 0.025 MHz or finer for scans that feed the exclusion threshold. Depending on the analyzer, that may mean multiple sweeps of smaller spans. See Indications of a good scan for what healthy scan data looks like.