Customize plot settings
Here you can customize the plot settings for your selected site.
To customize the plot settings:
-
In the frequency plot, click on the
 button.
A new window opens.
button.
A new window opens.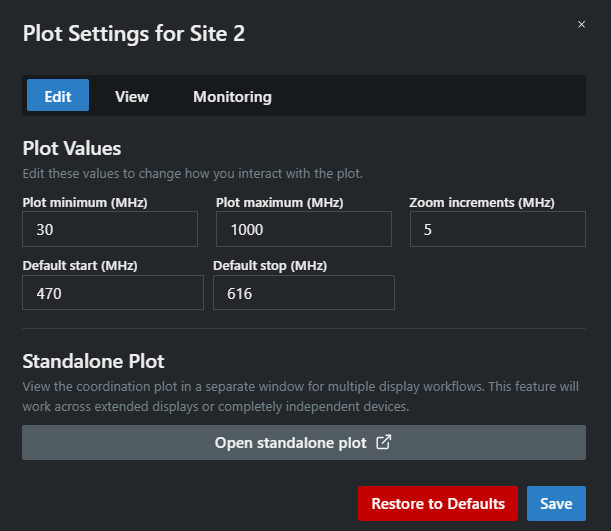
-
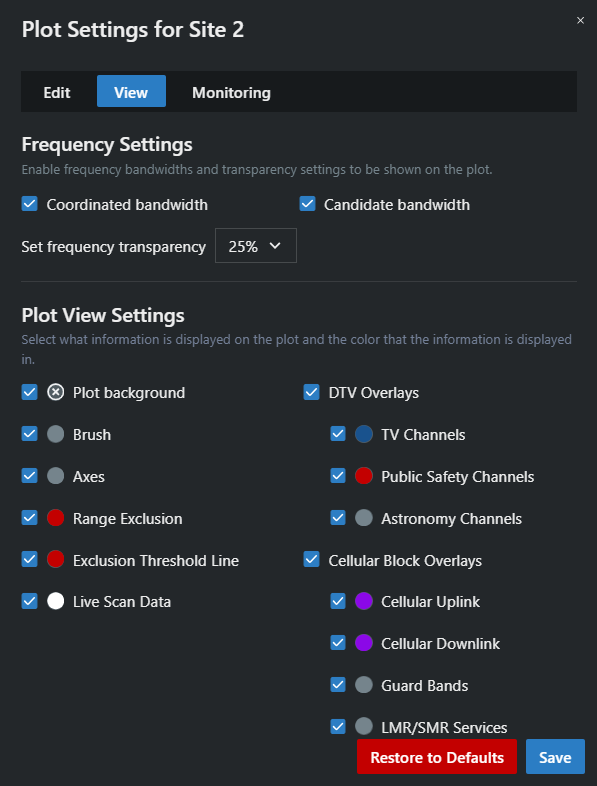
In the View tab:
- Select whether to display frequencies in the plot as profile bandwidth
- Adjust the transparency level of frequencies shown in the plot
- Choose which information to show on the plot and select its display color.
-
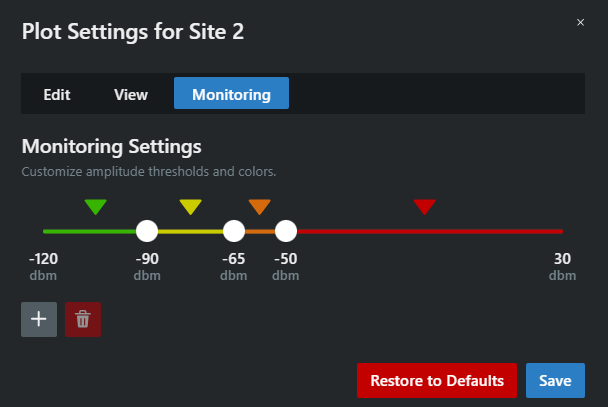
In the Monitoring tab:
- Customize the amplitude thresholds and colors based on the dB value.
- Customize the amplitude thresholds and colors based on the dB value.