
You can select the spectrum to monitor in the plot area.
To set the plot bandwidth for your spectrum:
‣ In the Plot Area , click on the ‣ button.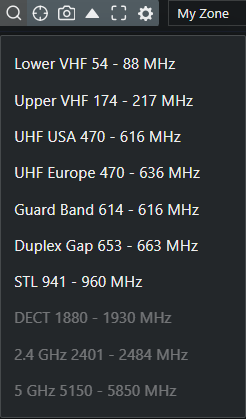
‣ A new dropdown menu opens.
‣ Choose your spectrum from the dropdown menu.

The bandwidth for your spectrum has been set.