
Here you can customize the plot settings for your selected site.
To customize the plot settings:
‣ In the frequency plot, click on the ‣ button.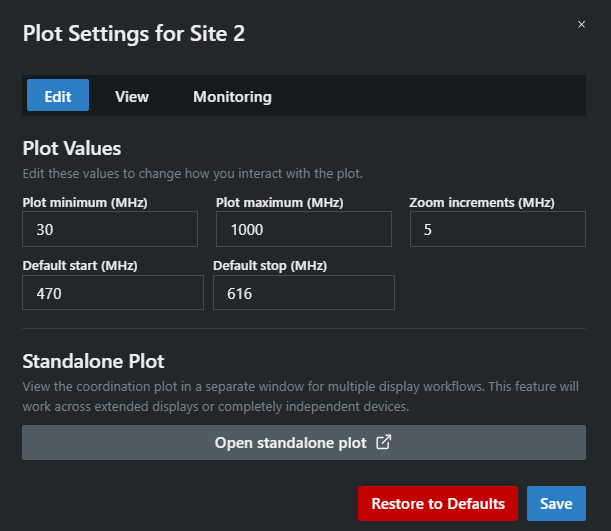
‣ A new window opens.
‣ In the Edit tab:
- Adjust the plot minimum, plot maximum, and zoom increments
- Set the default start and stop values
- Open a standalone plot in a separate display
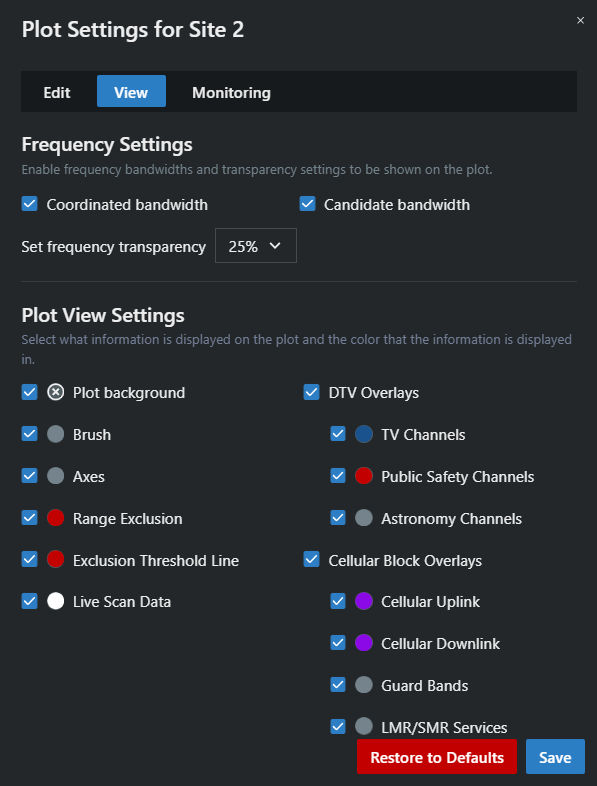
‣ In the View tab:
- Select whether to display frequencies in the plot as profile bandwidth
- Adjust the transparency level of frequencies shown in the plot
- Choose which information to show on the plot and select its display color.
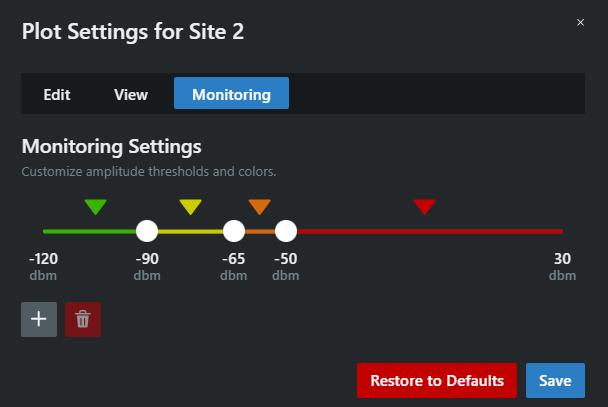
‣ In the Monitoring tab:
- Customize the amplitude thresholds and colors based on the dB value.

Your plot settings have been sutomized.