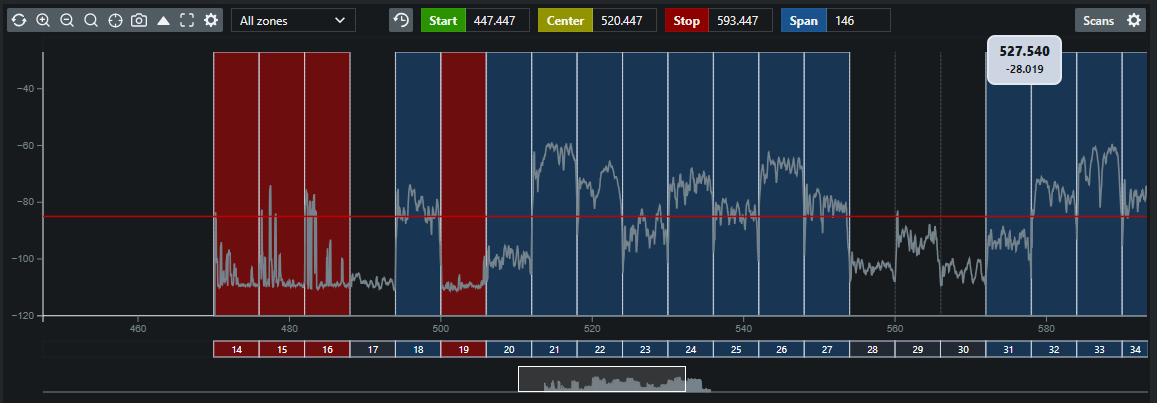

Default Bandwidth (470 MHz - 616 MHz)
- Sets the default bandwidth

Zoom in
- Zooms in the plot area

Zoom out
- Zooms out the plot area

Set plot bandwidth - spectrum

Set plot bandwidth - equipment profiles

Y-axis autoscale
- Automatically adjusts the y-axis scale to show the highest value at the top of the plot

Expand/collapse plot
- Expands the plot to fill the entire browser window or collapses it back to its normal size

Plot settings
- Opens the plot settings for the current site within the project

Plot zone selector
- Selects which zone frequencies to display on the plot

Previous view
- Restores the previous view of the plot

Scan selector
- Displays available scans for selection and viewing

Selected plot area
- Allows you to drag and pan the viewing area within the plot
Creating new frequency coordinationSetting plot bandwidth - spectrumSetting plot bandwidth - equipmentExporting plot viewCustomize plot settingsSelecting plot zoneCreating new bandplanAdding new device
