
The way the plot is drawn in the app connects each measured point to the next, creating the trace line.
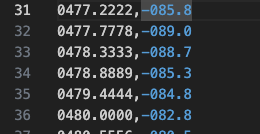
When calculating frequencies, it considers each measured value and only reports a "hit" if a candidate's bandwidth intersects with the measured point.
Example:
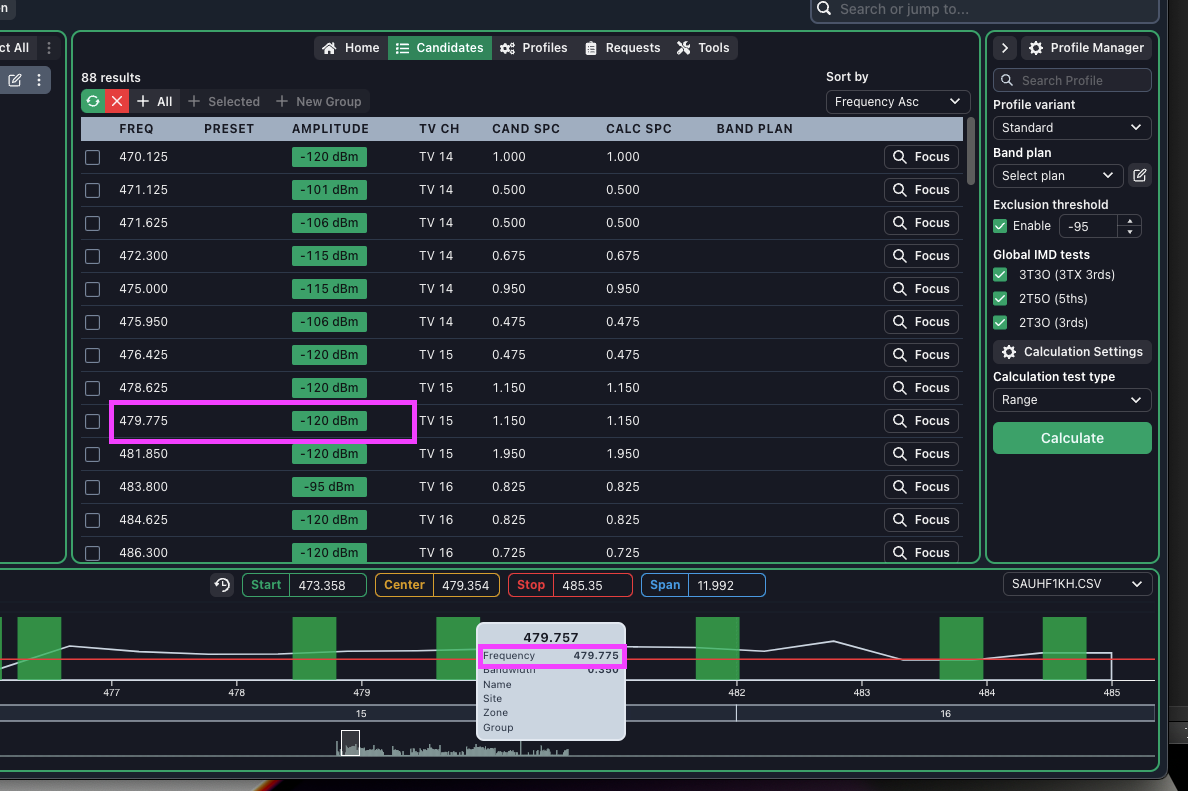
Visually, it looks like this candidate should be considered above the exclusion threshold. However, if we look at the captured data points for this area, there are not enough data points available to reliably calculate whether the measured data is actually above the threshold line. If there is no nearby data point, then the candidate AMPLITUDE column reports -120 (the minimum value on the plot).
In short, we recommend a step size of 0.025 MHz if possible. This means you may have to create more sweeps of smaller bandwidths, depending on the device.