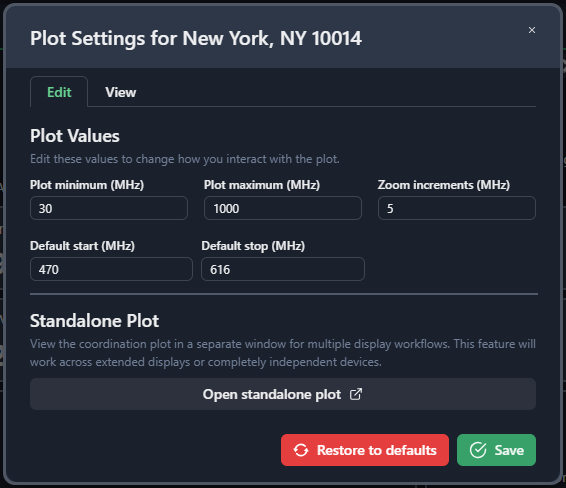
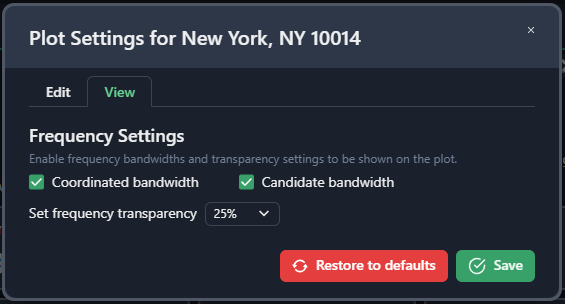
Clicking here will open up the plot settings for just the current site in the project
Edit Window:

- Change the plot minimum and plot maximum and the zoom increments
- set the default start and stop
- open up a standalone plot in a seperate display
View Window

- Choose whether frequencies will show up in the plot as the actual profile bandwidth
- Set the transparency of the frequency displayed on the plot.
