Across the top of the details area you have 4 areas of focus: Home, Candidates, Profiles, Requests, and Tools
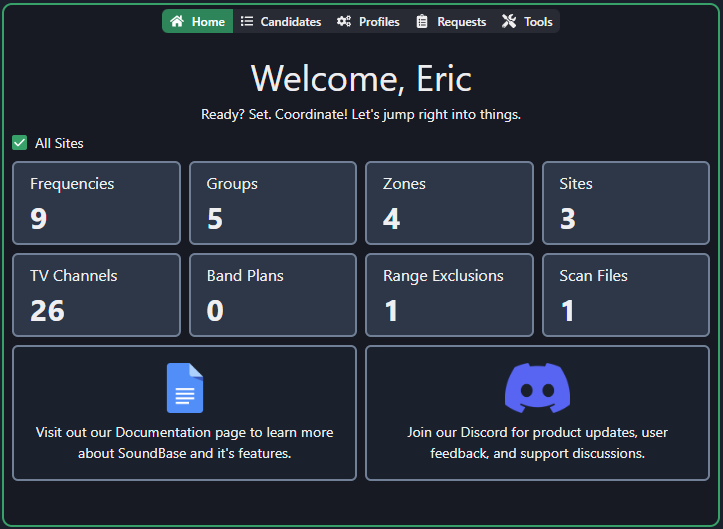
- Home
- This gives you some cool data to know about your current site.
- If you tick the “All Sites” box the totals will reflect the numbers across the entire project.
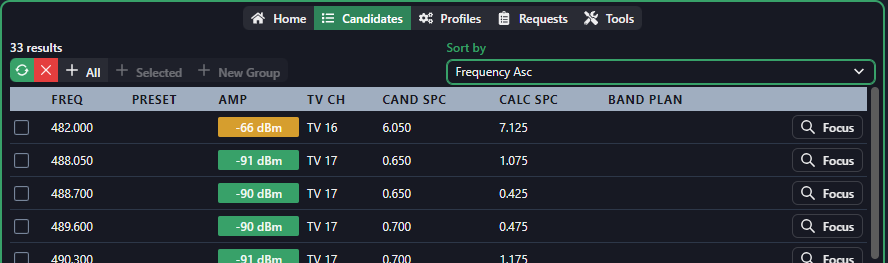
- Candidates:
- This are will be populated by frequencies found by using the calculation area
- Click +All to add all discovered candidates to the currently selected group.
- Click +Selected to add selected candidates to the currently selected group
- Click +New Group to create a new group and add selected candidates to that group
- Click the refresh button to re-run the search
- Click the red X to clear the search results
- The Focus Button on the left of the results will focus the plot on the selected freq.
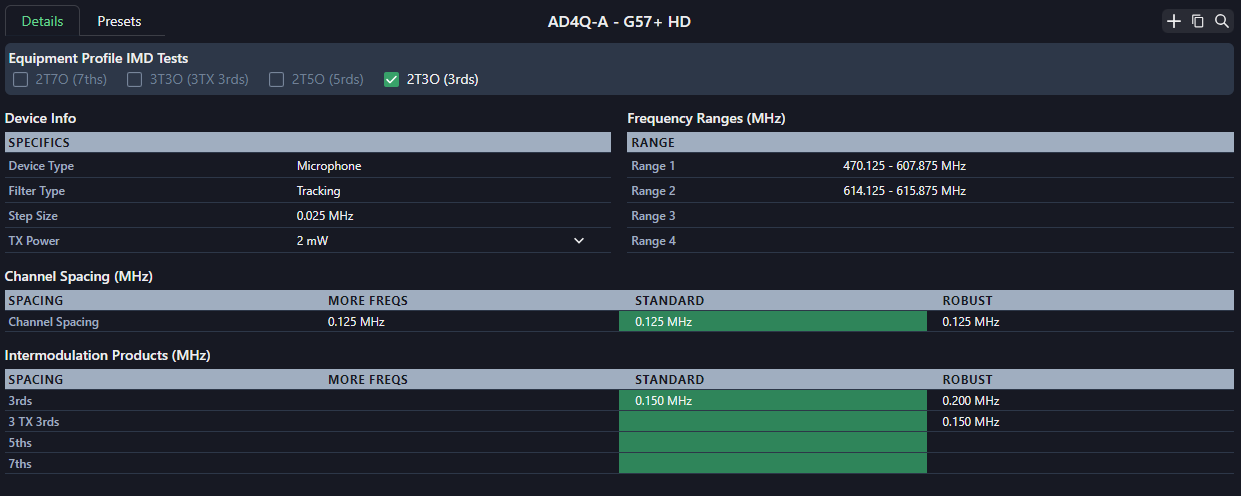
- Profiles:
- When you have a profile selected in the calculation area this area will display those details, this information is purely informational and can’t be edited.
- The upper right area of the profile is where you can add, copy, and focus the plot to the profiles bandwidth. if you are looking at a custom profile you will also see an edit button and a delete button:
- Creating a new profile: Click the plus icon to start the process of creating a new profile.
- Click the copy icon to duplicate your current profile that you can then edit
- Click the edit button to change the current profile
- Click the trash icon to delete the profile (deleting a profile will not affect projects that have used that profile in the past.
- Click the magnifying glass to focus the plot on the current profiles bandwidth